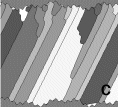
To further investigate the model of Urai et al. (1991), a computer program was written to simulate the crack-seal process. The model is only briefly described here, and the reader is referred to the full description of the model and a first systematic investigation with the model that are given by Bons (in press a) and Hilgers et al. (in press). In the 2-dimensional model, grains are defined by nodes that are linked by straight boundary segments. An initial horizontal surface fracture is created with a user-defined roughness. Every N time steps, the lower fracture surface is moved a user-defined distance and direction to simulate a crack-opening event. All grain surfaces that are then exposed to the open fracture grow outward by repeatedly moving the boundary segments over small distances one at a time. The segments are moved until they reach the other side of the fracture space (Fig. B2). The rate of growth is a function of the angle (a) between the boundary segment and the c-axis of a grain, which defines the lattice orientation. The type of function defines the growth habit of the crystal and therefore different "minerals" can be defined. In the examples below, two "minerals" were used:
- "Square mineral". The growth rate is fastest in the directions parallel and perpendicular to the c-axis. The habit of this mineral is that of a square.
- "Prismatic mineral". Growth is fastest parallel to the c-axis and slowest normal to it. A secondary growth rate minimum occurs at 30° to the c-axis, which gives the mineral a quartz-like prismatic habit.
Growth in an open cavity
Growth in an open cavity best illustrates the effect of different mineral
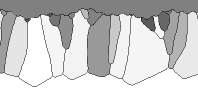
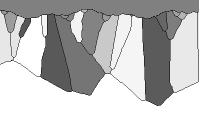
types on the morphology of the vein fill. Figure B3.a shows the result
of 800 growth steps of the prismatic mineral into a wide open fracture
with a rough surface. The shading of the grains is a function of the c-axis
orientation. One can see that the grains with a vertical c-axis (light)
quickly outgrow differently oriented grains. Figure B3.b shows the same
for 640 growth steps for the square mineral. Both grains with vertical
(light) as well as with horizontal (dark) c-axes are now the "winner" grains.
Crack-sealing with a vertical opening trajectory - effect of crack-width
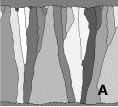
Three movies (Fig. B4) show the effect of the crack width. Figure B4.a
shows growth in many (154), but small (2 pixels) vertical fracture opening
events. Grain boundaries quickly get locked on ridges, resulting in little
reduction in average grain width as growth progresses. The spacing of the
ridges determines the width of grains. If, keeping all other parameters
the same, the fracture opening is doubled to four pixels per event (Fig.
B4.b), we see a decrease in locking capability of the ridges and a slightly
larger average grain width developing. Increasing the fracture width to
16 pixels (Fig. B4.c) results in almost complete loss of locking capability
of ridges. These simulations confirm the model of Urai et al. (1991),
that the locking capability of ridges is a function of the width of the
fracture relative to the roughness of the fracture. The rougher a fracture
and/or the thinner the fracture, the better is the locking capability and
hence the tracking capability of the vein crystals. The spacing between
ridges determines the average crystal width when locking is strong.
Crack-sealing with an oblique opening trajectory - effect of crack roughness
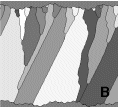
Figure B5 shows three movies of growth with an oblique (Dx=-2
& Dy=4) opening direction, while all other
parameters are kept the same except the roughness amplitude. The fracture
surface is too smooth in Fig. B5.a for any ridges to lock grain boundaries.
The average grain width increases in the growth direction and there is
no tracking whatsoever of the oblique opening direction. Doubling the amplitude
of the roughness (Fig. B5.b) leads to locking of some boundaries, but not
all. Therefore, some boundaries follow the oblique opening trajectory,
while others grow vertically. The result is a specific microstructure with
some strongly elongate grains, some large blade like crystals and many
"looser" grains (see Fig. 1.c in Bons & Jessell 1997). A further increase
in surface roughness (Fig. B5.c) produces a better locking capability of
the ridges and hence better tracking of the opening trajectory.
Crack-sealing - change of opening direction
Finally, a case of growth with an abrupt change of opening direction
is shown in Fig. B6. The case shown is for isotropic growth with a rough
fracture surface, resulting in perfect tracking of the opening trajectory
in the first growth period. After an abrupt change in opening direction,
perfect tracking is maintained, but several fibres get truncated soon after
the change in direction. Such a sudden increase in average fibre width
is often seen associated with a change in opening direction (Fig. 14.b).
The change in opening direction causes a change in the points where grain
boundaries are locked. Temporary unlocking during the transition period
frees the grain boundary for lateral movement and possibly the truncation
of the grain.


