5.6
ORIENTATION IMAGES OF NATURALLY DEFORMED ROCKS
top / contents / section 5 / pages -- 5.1 -- 5.2 -- 5.3 -- 5.4 -- 5.5 -- 5.6
Carrara Marble
(Nils Oesterling)
Carrara Marble is cropping out in the Western part of the Alpi Apuane tectonic window. In this region two deformation phases are distinguishable (Carmingnani & Kligfield, 1990).
The main deformation phase (D1, Oligocene-Miocene) is characterized by greenschist facies conditions associated with isoclinally folding and the initation of West dipping thrust faults producing an antiformal stack at the crustal scale. After D1 the region was heated statically, i.e. annealing occured while, obliterated most of the D1-deformation structures. The peak metamorphic temperatures during annealing vary between 380°C in the East and 430°C in the West.
During the second deformation phase (D2, Miocene) the whole complex was refolded under retrograde conditions in an extensional region. As a result of this deformation millimeter- to centimeter-scale shear zones were formed.
Left, from top to bottom:
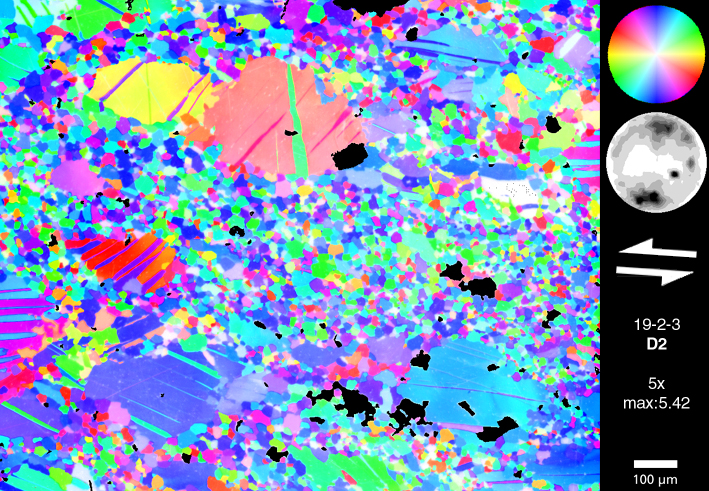
Fig. 1: CIP-c-axis-orientation-image of the center of the D2 shear zone.The core-mantle-structure are typical for subgrain rotation recrystallization. The calculated pole figure shows two discrete maxima which are slightly inclined towards the compression direction. This feature is indicative of twin gliding.
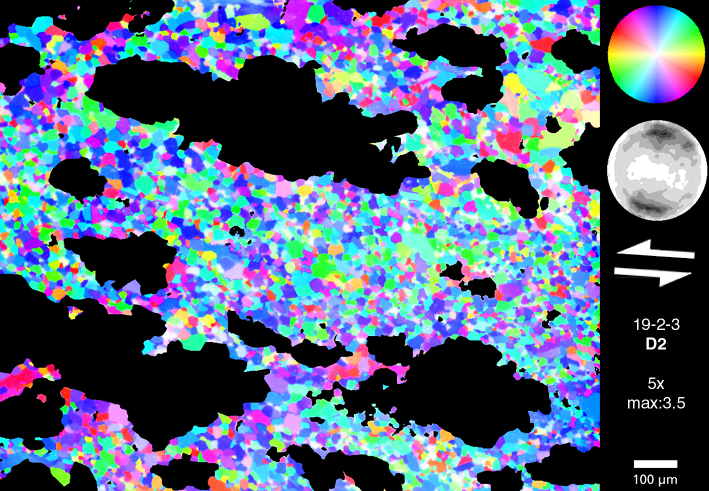
Fig. 2: CIP-c-axis-orientation-image of the center of the D2 shear zone. Relict grains are masked. The calculated polefigure shows two diffuse maxima indicating subgrain rotation recrystallization. The influence of the relict grains on the bulk texture can be seen by comparison with Fig. 1.
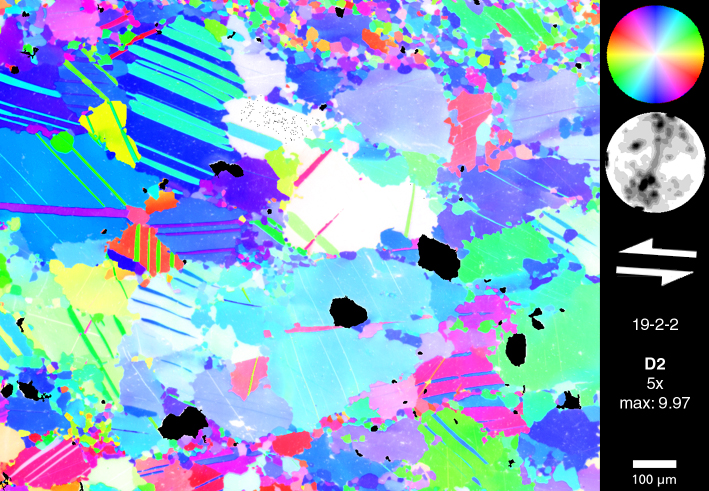
Fig. 3: CIP-c-axis-orientation-image of the boundary region of the D2-shear zone. The calculated pole figure shows two maxima slightly inclined toward the compression direction (indicative of twin gliding), two maxima subparallel to the shear zone boundary, and a single maximum subperpendicular to the shear zone boundary.
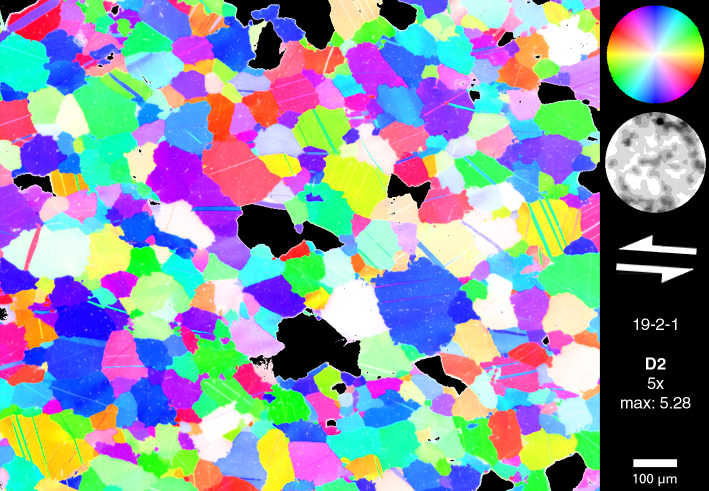
Fig. 4: CIP-c-axis-orientation-image of the annealed pre-D2 marble. The calculated pole figure is isotropic showing maybe a very weak maximum subperpendicular to the shear zone boundary. In addition to this feature, the equiaxial grainsize is an evidence of annealing.
Oesterling, N., PhD thesis, Dept. of Geosciences, Basel University (http://www.unibas.ch/earth/)