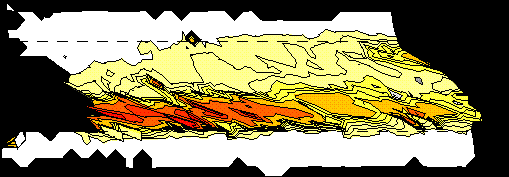
The figure shows contours of axial ratios of the incremental strain ellipses (for contour intervals of the figure above press the HT-LS button). This strain distribution pattern was calculated by the aid of passive marker particles and the computer program Marker Analysis (Bons, P.D., Jessell, M.W. & Passchier, C. 1993).
Basically most of the area between the frosted grips is deformed but, at this shear strain, intermediate to high strained areas concentrate near the lower shear zone boundary. Interestingly, the areas of the highest contour intervals are obliquely oriented with respect to the SZB.