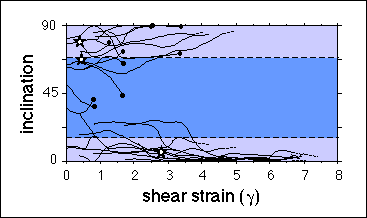
This diagram shows the changes in c-axis inclinations with increasing shear strain.
The steeper the curve, the faster the rate of crystallographic rotation. Therefore, grains with paths type I and II correspond to flat curves in the diagram, indicating low rates of inclinational change, whereas grains with type III rotation behavior are reflected by steep curves (inclination range 20-75°) indicating high rates of inclinational change.
Obviously, grains with type III c-axis rotation paths have the lowest survival potential whereas type I and type II grains have a high survival potential.