Microstructural Development During Deformation
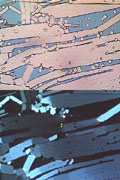
Crystal plastic deformation by slip inside crystals and dynamic recrystallization is observed during faster strain-rate (~10% per hour) experiments. Sequences of photomicrographs in Figure 7 were taken during a deformation experiment at constant temperature (30oC) and strain rate ~10-4.5 shortening per second. The grip geometry used in this experiment was pure shearing with the shortening direction parallel to the horizontal edges of the photomicrographs, although simple shearing between the white phase crystals W1 & W2 is noticeable in the field of view. The white phase crystal W2 (Figure 7) was initially oriented subparallel to the shortening direction. Microstructures developed during crystal plastic deformation of this crystal include progressive bending, as in flexural slip folding, undulose extinction, slip traces in the crystal parallel to the outer rational crystal-melt interface, and possibly cuspy crystal-melt interfaces (indicated by arrows in the last frame of Figure 7). Features similar to the cuspy crystal-melt interface in Figure 7 have been repeatedly observed in other high strain-rate experiments, and sometimes it has been observed that the cuspy interface leads to segmentation of a crystal by tip propagation. The origin of the cuspy crystal-melt interfaces is not clear. One possibility for the development of such structure is that there may be existence of substructures at the cuspy interface. For example, if a subgrain boundary exists, it may lead to development of a cuspy interface, since high defect density near the subgrain boundary can cause increase in solubility. Segmented pieces of crystals (W3 and W4 in Figure 7) which were originally a part of the white phase crystal W2, underwent extensive dynamic recrystallization while interstitial melt was removed by filter pressing. These microstructures formed by dynamic recrystallization are similar to those formed in the solid state, and usually thought of as the result of solid-state deformation (e.g. Paterson et al, 1989).
Contact Melting during Slow Strain-Rate Deformation
The deformation process of contact melting/redeposition has been observed during slow strain-rate experiments (~10-5.5 per second or about an order of magnitude slower than the strain rate at which crystal plasticity is observed). The descriptive term contact melting/redeposition is used instead of the well established term - pressure solution, since the precise mechanism of dissolution is not known here. Possible causes for dissolution are solubility increase or chemical potential increase due to higher normal stress (Robin, 1978), solubility increase due to stored elastic strain energy in a crystal (Sprunt & Nur, 1977), and solubility increase due to high defect density (Bosworth, 1981; Lasaga, 1981).
Contrary to strain accommodation by bending of a crystal whose long dimension was subparallel to the shortening direction during faster strain-rate experiments (Figure 7), strain accommodation by contact melting occurs, when strain rate is slow enough, by shortening of a crystal by melting at its end(s) or boundaries facing the shortening direction. This is observed in crystal W1 in Figure 8 oriented similarly to the crystal in Figure 7. This crystal shows length decrease by contact melting at its contacts with crystals, W2 and/or W3. Since there is not sufficient bending or bulging to account for the shortening in the white phase crystal W1, the interpretation of crystal length decrease without crystal plastic deformation seems reasonable. The local strain accommodated by contact melting of the white phase crystal W1 is approximately 30% shortening (Figure 8). Slight bending of the white phase crystal W1 (near the last frame of Figure 8) may have driven the grain-boundary migration which led to dissection of the white phase crystal W1 by W4.
Contact melting at phase boundaries (boundaries between two different phases) is also observed in Figure 8. The white phase crystal W5 in Figure 8 is forming phase boundaries (in the second frame of Figure 8) with two cube phase crystals (indicated with arrows) by displacement of the cube phase crystals relative to the white phase crystal W5. After further shortening, the two cube crystals initially separated by the white phase crystal W5, are touching each other and forming a displacement-impingement boundary. This seems to be the result of melting of the white phase crystal W5 at the phase boundaries instead of crystal plastic deformation, since no length increase in W5 is observed. Different ability for contact melting for different solid phases can be inferred since the cube phase crystals do not change their crystal shape during contact melting of the white phase crystal W5. Such preferential dissolution by contact melting on one side of a boundary also occurs at grain boundaries. An example of an indented grain boundary produced by preferential contact melting is shown by the white phase crystal W6 in the last frame of Figure 8. This type of microstructure may be useful to identify the process of contact melting/redeposition.
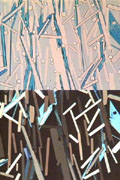
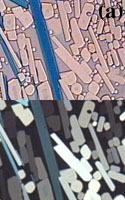
Another example of contact melting/redeposition is shown in Figure 9a. Contact between the blue phase crystal B1 and the white phase crystal W1 was initially a point contact formed by growth of the two crystals. The point contact becomes wider as deformation progresses and this is the result of dissolution of the white phase crystal W1 at the contact. The dissolved constituents from the crystals will result in local increase in the concentration of the constituents, and this will lead to crystallization or redeposition somewhere else in order to maintain chemical equilibrium. Such a process can be observed in the white phase crystals bordering local melt pockets (e.g. white phase crystal W3 in Figure 9a).
In general, contact melting occurs at boundaries oriented at a high angle to the shortening direction. Although the mechanism of dissolution is not precisely known, the orientation of the contact melting boundaries suggests that higher normal stress on these boundaries are related directly (through elastic strain energy) or indirectly (through plastic strain energy) to contact melting.
Sliding on Crystal Boundaries
Sliding on the boundaries between crystals is active, regardless of the strain rate. Grain-boundary migration and contact melting have been observed as accommodation processes during sliding in slow strain-rate experiments. For example, grain-boundary sliding occurs along the grain boundary between the white phase crystals W1 and W2 between the stages Figure 9a. Sliding on the grain boundary is possible since the local space problem is solved by contact melting of W1 at the B1-W1 boundary. Grain-boundary migration also assists sliding (Figure 9a). The original sliding boundary (between W1 and W2) changes its orientation after grain-boundary migration, and further sliding becomes possible on the new grain boundary of a new orientation. Contact-melting-accommodated-sliding and grain-boundary-migration-assisted sliding allow large strains in the solid framework without internal deformation of the crystals.
Filter Pressing
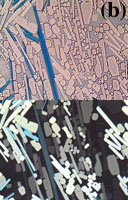
Two different types of filter pressing have been observed in our experiments; (1) filter pressing which involves crystal plastic deformation with dynamic recrystallization (Figure 7), and (2) filter pressing which involves contact melting/redeposition and crystal-boundary sliding (Figure 8, 9b). When filter pressing occurs, a signature of the process is likely to be found in the spatial distribution of local chemical composition, since the melt, usually of different composition from the framework crystals, is removed during filter pressing. If filter pressing occurs during the early stage of crystallization, the formation of a nearly monominerallic rock or adcumulus is possible. If crystal plastic deformation and dynamic recrystallization are occurring during filter pressing, the resulting microstructures in the monominerallic part will be similar to the microstructures formed in solid-state deformation. Layers of igneous rocks which show strong evidence of crystal plastic deformation neighbored by less deformed or undeformed comagmatic igneous layers may indicate filter pressing at strain rates fast enough to operate deformation processes of crystal plasticity and dynamic recrystallization.
If cryptic processes such as contact melting and grain-boundary sliding are involved during filter pressing, the residual part will be undeformed-looking as shown in our experiments. Undeformed-looking adcumulus is commonly associated with large mafic intrusions and petrologists have been working on the problem of how the interstitial melt is removed from the adcumulus. Walker et al (1988) explain the formation of adcumulus with a zone refining model in which diffusion under a thermal gradient is involved. Since the liquid phase is removed by continuous reequilibration between interstitial melt and the main reservoir of magma by diffusion (Walker et al, 1988), the resulting crystal to crystal boundaries in the cumulate will be growth-impingement boundaries. However, when contact melting is involved during formation of adcumulus, the resulting crystal to crystal boundaries will be dissolution boundaries at which dissolution of one or two neighboring crystals occurred. Detailed petrographic work, including chemical imaging to see microstructures such as truncated zoning by grain or phase boundaries, may help to determine whether contact melting contributed to the formation of adcumulus.
Grain Flow
Grain flow or granular flow is a process similar to cataclastic flow in which most of strain is accommodated by sliding along boundaries and rotation of crystals. It is a term introduced by sedimentologists (Carter, 1975) for deformation of close-packed granular sediments with interstitial fluid, but it also seems to be appropriate for the present crystal/melt mixtures. Figure 10a shows accumulation of large shear strain (shearstrain>~5 between the first and last stage of Figure10a) of a solid framework by grain flow at a low melt fraction. Subparallel alignment of crystals to the flow plane (parallel to width of photomicrographs), resulting from rotation of crystals, is developed during deformation (near the last frame in Figure 10a). Significant localization of deformation is also observed to develop subparallel to the width of photomicrographs near the center of Figure 10a.
When a solid framework is deforming by grain flow which involves grain-boundary sliding and rotation of crystals, a shape preferred orientation may develop by rigid body rotation of crystals and tiling effects (Tikoff & Teyssier, 1994). Preferred orientation of euhedral igneous minerals may be formed by rotation of crystals during grain flow even after formation of the solid framework, but since such shape preferred orientation is also possible by suspension flow or magmatic flow (Paterson et al, 1989), it is not always a reliable criterion for grain flow at low melt fraction. However, when all the phases present in a rock show shape preferred orientation instead of one phase, such shape preferred orientation can be more reliably interpreted as the result of grain flow at low melt fraction instead of suspension flow, since the melt fraction should be low to have multiple phases saturated in a normal magma system with a bulk composition close to the eutectic composition. However, this criterion should also be carefully applied, since there is a possibility that later crystallizing crystals can fill the interstitial spaces between the crystals with developed shape preferred orientation and may also show shape preferred orientation simply by mimicking the preexisting fabric.
Development of a Micro Shear Zone during Grain Flow
The term micro shear zone is used here for a zone with the width of one or two crystals where grain-boundary sliding is concentrated. An example from a sample of low melt fraction is shown in Figure 10b. It is noteworthy that such zones can develop without drawing melt into the zone. It is also remarkable that the micro shear zone (shaded region in Figure 10b) texturally closely resembles the surrounding regions. A cryptic kinematic domain of this kind would be difficult to recognize in rocks.
When a micro shear zone develops in a framework, recognition of such zones will be dependent on the nature of the zones. The resulting microstructure will be cryptic as observed from our experiments (Figure 10b), when a micro shear zone develops without change in the local melt fraction. However, when the melt fraction increases or decreases in a micro shear zone, melt drawn into the high strain zone or expelled from it will have a different chemistry compared to the whole rock, since the melt has a more evolved composition compared to the bulk composition of crystal-melt mixtures at the time of deformation. After crystallization, such melt zones during deformation will be the zones of slightly different mineral assemblages compared to the whole rock but in chemical equilibrium with the crystalline phases present in the neighboring region. Recognition of chemical equilibrium is important since a different mineral assemblage in such zones can also be formed by igneous veining or injection of a small dike.
Shearing during Heating
Melting experiments during deformation have been performed at melting rates slow enough relative to deformation rates to preserve a high proportion of the solid to solid contacts. Figure 11a is a time-lapse movie from a melting and deformation experiment. Melting of the blue phase crystals is most noticeable, but white and cube phase crystals are also melting. During melting, localized zone of deformation is developed near the area where large amount of melt is generated mostly by dissolution of the blue phase crystals. After complete melting of blue phase crystals, displacement impingement boundaries between white crystals form (the last frame of Figure 11a).
The particle trajectories in Figure 11b are the trajectories constructed from the 11th to 16th frames after the 11th frame. The reference frame origin for the trajectory map is indicated by a star in Figure 11b, and horizontal edges of photomicrographs were used as one axis of an orthogonal reference frame. Above the subhorizontal high strain-rate zone that developed around the stage of the 6th frame in Figure 11a (also indicated as shaded region in Figure 11b), the direction of displacement vectors at the right and left edges on the map, points toward the origin, indicating some component of horizontal shortening. The shortening in the upper region is the result of blue phase crystal melting or the result of melt extraction and consequent displacement of white phase crystals. In the high strain-rate zone, an increase of the melt fraction is noticeable but no other textural feature distinguishes the zone from the more slowly straining material above it. Although it is not clear whether the extra melt in the zone is coming from the upper region or somewhere else, coincidence of the high melt fraction zone and the high strain-rate zone may suggest, firstly, development of the high strain-rate zone initiated by local melt fraction increase during melting, or secondly, melt drawn into the dilating high strain-rate zone as suggested by Hollister and Crawford (1986).


