6.4
WHERE CAN WE GO FROM HERE ?
top / contents / section 6 / pages -- 6.1 -- 6.2 -- 6.3 -- 6.4 -- 6.5 -- 6.6 -- 6.7 -- 6.8
Comparing CIP and EBSD
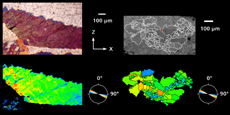
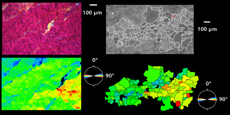
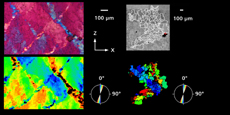
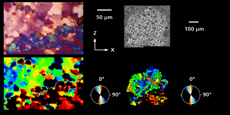
In order to compare the crystallographically complete but discrete information of the EBSD analysis with the spatially continuous but crystallographically incomplete information provided by the CIP analysis, the following procedure can be adopted:
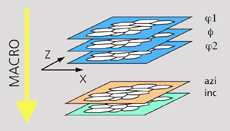
Using NIH Image and the "Lazy Euler" macro, the azimuths and inclinations of the c-axis orientations are calculated from the three Euler angles. The macro fills the outlines of the first, the second and the third slice with the grey levels that correspond to the phi1-, psi- and phi2-values obtained from EBSD measurements. From these, the azimuths and inclinations of the c-axes (azi, inc) are calculated the corresponding grey values are filled into the outlines of the fourth and fifth slice.
Left, from top to bottom (clockwise from upper left):
Photomicrograph, OC contrast image, orientation image from EBSD measurements, and optical orientation image (COI)
- for samples A, B, C, D (same samples as on page 5.3)
