6.8
WHERE CAN WE GO FROM HERE ?
top / contents / section 6 / pages -- 6.1 -- 6.2 -- 6.3 -- 6.4 -- 6.5 -- 6.6 -- 6.7 -- 6.8
Misorientations at grain boundaries of "flat" orientation images


Using NIH Image and the "Lazy azi inc & flat" macro, the azi and inc images, and the grain boundary map are used to create azi and inc images where each grain on the grain boundary map is assigned the average azimuth or average inclination of that grain. From these "flat" azi and inc images "flat"COIs and orientation gradient images can be calculated. The orientation gradient images show sharp grain boundaries of one pixel width., the slope of the gradient is really the angular difference between the grains.
Left, from top to bottom:
- Illustration of conversion from c-axis orientation image with continuously variable orientations to one where each grain has only one constant orientation
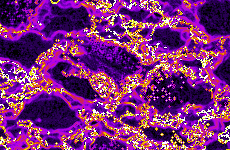
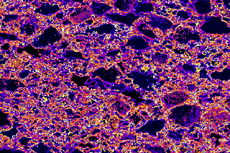
- Orientation gradient image of regular input images
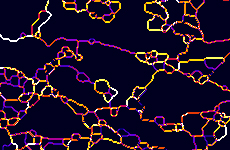
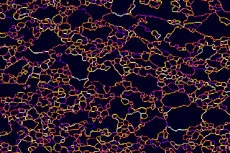
- Orientation gradient image of flat input images
Detail of orientation gradient image (regular input)
Below:
detail of orientation gradient image (regular input)


