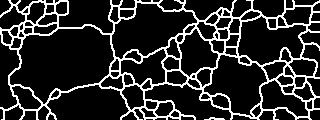

A set of procedures is described by which the 3-D grain size distribution (the distribution of the radii of spheres, i.e., three-dimensional grains) is derived from grain boundary maps. To obtain grain boundary maps, the program described in Part I (Grain boundary detection) may be used.
|
|
|
After the grain boundary maps are saved, the standard NIH Image Analyze menu is used for measuring the cross sectional areas of the grains. The menu item "Set Scale..." is set to "pixels", and in "Options...", at least "areas" and "perimeter" have to be checked; additional options may be included. Using "Analyze Particles...", the analysis is performed and the list of measurements is exported and saved.
A spread sheet program such as Kaleidagraph is used to calculate the equivalent radii of the cross-sectional areas from the measurement file. As a first step, the area measurements have to be corrected: Because of the heavy outlining that is required for the NIH Image Analyze procedure, the cross sectional areas are too small: around each area a rim of one pixel width is missing. Since the cross sectional areas are given as square pixels and the perimeters as pixels, the missing boundary layer can be added by simply adding the number of pixels that correspond to the length of the perimeter (in pixels) to the area (in pixels). This corrected area is scaled and used to calculate the equivalent radius, i.e., the radius of the circle with the same area as the cross sectional area. The equivalent radii are grouped into a histogram of 20 classes, the bins are designated by their upper bound.
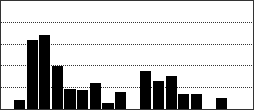
Finally, the program StripStar is used to calculate from the histogram of equivalent radii ( h(r) = number density of radii of circles) the parent distribution of spheres ( V(R) = volume density of radii of spheres). Using Kaleidagraph, the resulting histogram is plotted.
Start GRAIN SIZE ANALYSIS step 1 - step 2 - step 3 - step 4 - step 5