2.4
CALCULATING THE PRIMARY IMAGES
top / contents / section 2 / 2.1 -- 2.2 -- 2.3 -- 2.4 -- 2.5 -- 2.6 -- 2.7 -- 2.8 -- 2.9 -- 2.10 -- 2.11
Calculation of azimuth, inclination, and error images


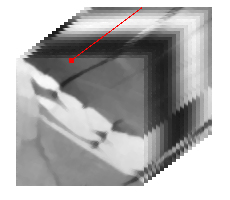
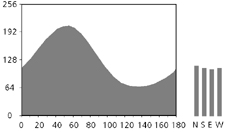
For each pixel, the grey levels in channel 1 to 18, determine a discrete optical density function (= inverse of brightness function). By fitting a curve to it (parabolic fit to the five largest and smallest values), the exact maximum and minimum of the curve and the phase angle are calculated. The error is given by the sum of all differences of the actual values to the ideal fit.
Subtracting the minimum of the curve from the maximum yields the amplitude. From the phase angle, the azimuth is calculated, and from the amplitude, a primary inclination between 0° and 90° is derived.
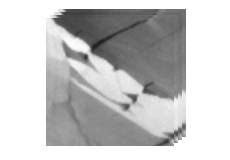
By comparing the grey values of the tilt images with the grey values in the zero rotation image, the tilt-correction is effected. This correction determines if a c-axis points above or below the plane of the thin section, and the primary inclination image is corrected accordingly. The final azimuth and inclination images are derived and saved.
The filename extension "azi" denotes the azimuth image, "inca" denotes that the inclination has been derived from the amplitude of the brightness curve, "incp" denotes that the inclination has been derived from the circular polarization image, "err" denotes the error image (= the inverse of it is the quality image).
Left, from top to bottom:
- Stack of 18 rotation images
- Schematic representation of optical density function from rotation images, i.e, density of a given pixel (red) as function of rotation, and four discrete density values from tilt images
- Stack of 4 tilt images