2.6
CALCULATING THE PRIMARY IMAGES
top / contents / section 2 / 2.1 -- 2.2 -- 2.3 -- 2.4 -- 2.5 -- 2.6 -- 2.7 -- 2.8 -- 2.9 -- 2.10 -- 2.11
The inclination image (amplitude)


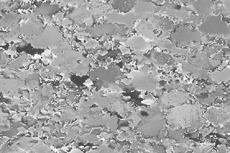
This inclination image has been derived from the amplitudes of the grey value functions G(rotation) of each pixel (remember that?).
The inclination of the c-axes refers to the image plane and runs from above the image plane to below: above (Heaven) is 0°, the horizontal is 90°, below (Hell) is 180°. The inclination file is monochrome (grey).
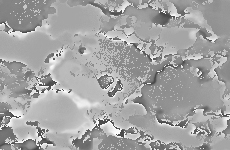
The chipmunk is a little spotty, grading from c-axes pointing above the image plane (lighter) to those pointing below it (darker). The fact that the transition is spotty rather than smooth is an artefact which is brought about by the tilt corrections for c-axes. There are many reasons why these artefacts occur: they can usually be traced to a critical c-axis orientation (azimuth around 0°, 90° or 180°), or to dust, inclusions or bubbles on the thin section...
Left, from top to bottom:
- inclination image (inca) of Black Hills quartzite
- stereographic projection (note orientation !) and orthogonal representation of look-up table for inclination image
- the spotty chipmunk...