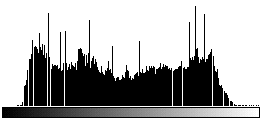
GOOD
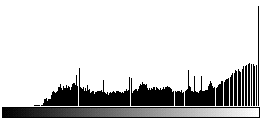
NOT GOOD: over-exposed


The aim here is to acquire a series of images which (when re-matched) will be the input for the CIP calculations. The standard input consists of rotation images, tilt images and a circular polarization image: the rotation images are a series of images with incremental relative rotation of the ALP-assembly (typically using a fixed interval of Dr =10°), the tilt images are images where the thin section is tilted about the vertical and horizontal image axis, and the circular polarization image can interpreted as an inclination image produced by analogue, i.e., optical means. 18 rotation images at 10° intervals and 2 tilt images are the absolute minimum, routinely, 19 rotation images, one circular polarization image and four tilt images are acquired (see below).
When all input images are placed in a stack we can think of it as a multichannel image which records for each pixel (a) the grey level, G(0), G(10)... G(170), for 18 different orientations, r = 0°, 10°,...170°, of the ALP-assembly, (b) a grey level indicative of the c-axis inclination w/r to the plane of the thin section, and 2 or 4 greylevels which - when compared to the greylevel G(0), yield an information whether the c-axis points above or below the thin section.
Throughout any given rotation and tilt series a constant exposure time MUST be retained. This ensures that the G(r) dependence is measured correctly for each pixel. As will be shown, the phase of this funcion indicates the azimuth of the c-axis, and the amplitude can be used to determine the inclination. However, since the calibration of the amplitude of the G(r) function is more difficult than the calibration of the circular polarization image, the latter is used for the derivation of the inclination whenever possible.
Routinely, the circular polarization image is captured first, the rotation images next, and the tilt images last. The exposure time is selected once for the circular polarization image and once for the rotation images including the tilt images: an exposure level of nearly two full f-stops underexposed is chosen. This will yield the correct exposure. (The exposure meter is engineered to consider light in the visible region only; when used with an infrared sensitive camera, it tends to over-expose). Correct exposure is tested by acquiring the image and inspoecting the histogram. The histogram should be centered and as wide spread as possible:
|
GOOD |
NOT GOOD: over-exposed |
|
|
|
Using Adobe Photoshop and the "EOS DCS x cameras" plug-in, the images are taken (i.e., shot and stored in the PCMCIA card) and acquired (i.e., transferred to the computer). Adobe Photoshop is preferred over NIH Image because it allows batch image acquisition whereas NIH Image permits single image acquisition only.
The initial position is when the thin section is aligned parallel to the vertical and horizontal image axis of the camera. The following sequence is captured; each image is a gray value matrix of 1268*1012 size and 8 bit gray level depth.
|
|
circular polarization image: r = 0° |
||
|
|
rotation images: r = 0°, 10° ... etc. to r = 180° rotation of microscope table is counterclockwise => c-axis travels clockwise on conoscopic image. |
||
|
|
tilt image EUP: r = 0°, East up, two different focus levels (see step 4) |
||
|
|
tilt image SUP: r = 0°, South up, two different focus levels (see step 4) |
||