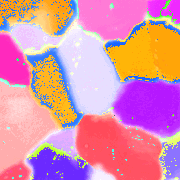

***.coi-CIP2
& CLUT
CIP2 calculates misorientation images, gradient images, a new orientation image and polar density matrix.
The c-axis orientation image (denoted bei ***.coi) visualizes the orientation of the c-axis by assigning unique colours to different orientations.
|
|
|
|
***.coi-CIP2 |
& CLUT |
The misorientation of the c-axis of a given pixel with respect to a reference direction is calculated and displayed as a grey value (0 ... 90). ***.misN, ***.misE, ***.misH, and ***.misR denote misorientations with respect to North, East, Heaven and reference direction (see ***.ctrl2 file and dialogue).
|
|
|
|
***.misN (North) |
***.misE (East) |
|
|
|
|
***.misH (Heaven) |
***.mis-45-55 (normal to octahedral plane) |
The local variation of c-axis orientation is obtained by gradient filtering: the angular differences of the c-axis of each pixel with respect to its neighbouring pixels are calculated and added. The of the corrected ***.inc file is used. ***.edg2 and ***.edg4 denote that 2 (top and left) or 4 (top, left, bottom and right) neighbours have been used.
|
|
|
|
***.edg2 (using 2 neighbours) |
***.edg4 (using 4 neighbours) |
From the azimuth and inclination images, histograms (***.cpf (calculated pole figure) = polar density matrix) are derived and stored follwing the conventions of MENTEX (ODF program). INVPIMA converts the ***.cpf file to a circular pole figure, ***.polfig (36·36), using the Schmidt projection. NIH Image and Lazy pole can be used to magnify the matrix and perform a contour shading.
|
|
|
|
***.polfig (from CIP2) |
***.polfig*5 (after Lazy grain boundary) |